Did you know, every 1% increase in customer satisfaction can boost customer retention rate by 5%!
Topped with the statistical bonanza, that companies offering outstanding personalized customer experience witness revenue growth 7.1 times higher than those that don’t, we can see with due clarity why the global market-worth of customer care BPOs is estimated to touch $34.57billion by 2028, with 7.55 CAGR.
Customer satisfaction, loyalty and retention have always been the nucleus of the success saga of businesses that have thrived through the ebbs and flows of the ever-fluctuating markets. This is perhaps the reason why professional inbound customer support is becoming a staple with companies, whether large, mid-sized or small.
However, what smaller, newer and transitioning companies often miss out on is the fact that all inbound call centers are not alike. Each set up is different in terms of quality and scope of services that can deeply impact the interest of hiring companies in terms of their customer satisfaction goals and expectations.
This is where, assessment of KPIs come into the picture. Taking a close look at the Key Performance Indicators of hired BPO services can offer valuable insights into the efficiency and effectiveness of their operations that eventually catalyzes unprecedented customer experience, or otherwise.In simple words, KPIs measure the success of call centers in creating the value your company expects to offer to customers as ‘experience’.
Need to know if your 3P contact centers are actually justifying your cost-per-seat? The answer lies in KPIs.
Did You Know: 73% Customers try new brands that have great customer support reputation.
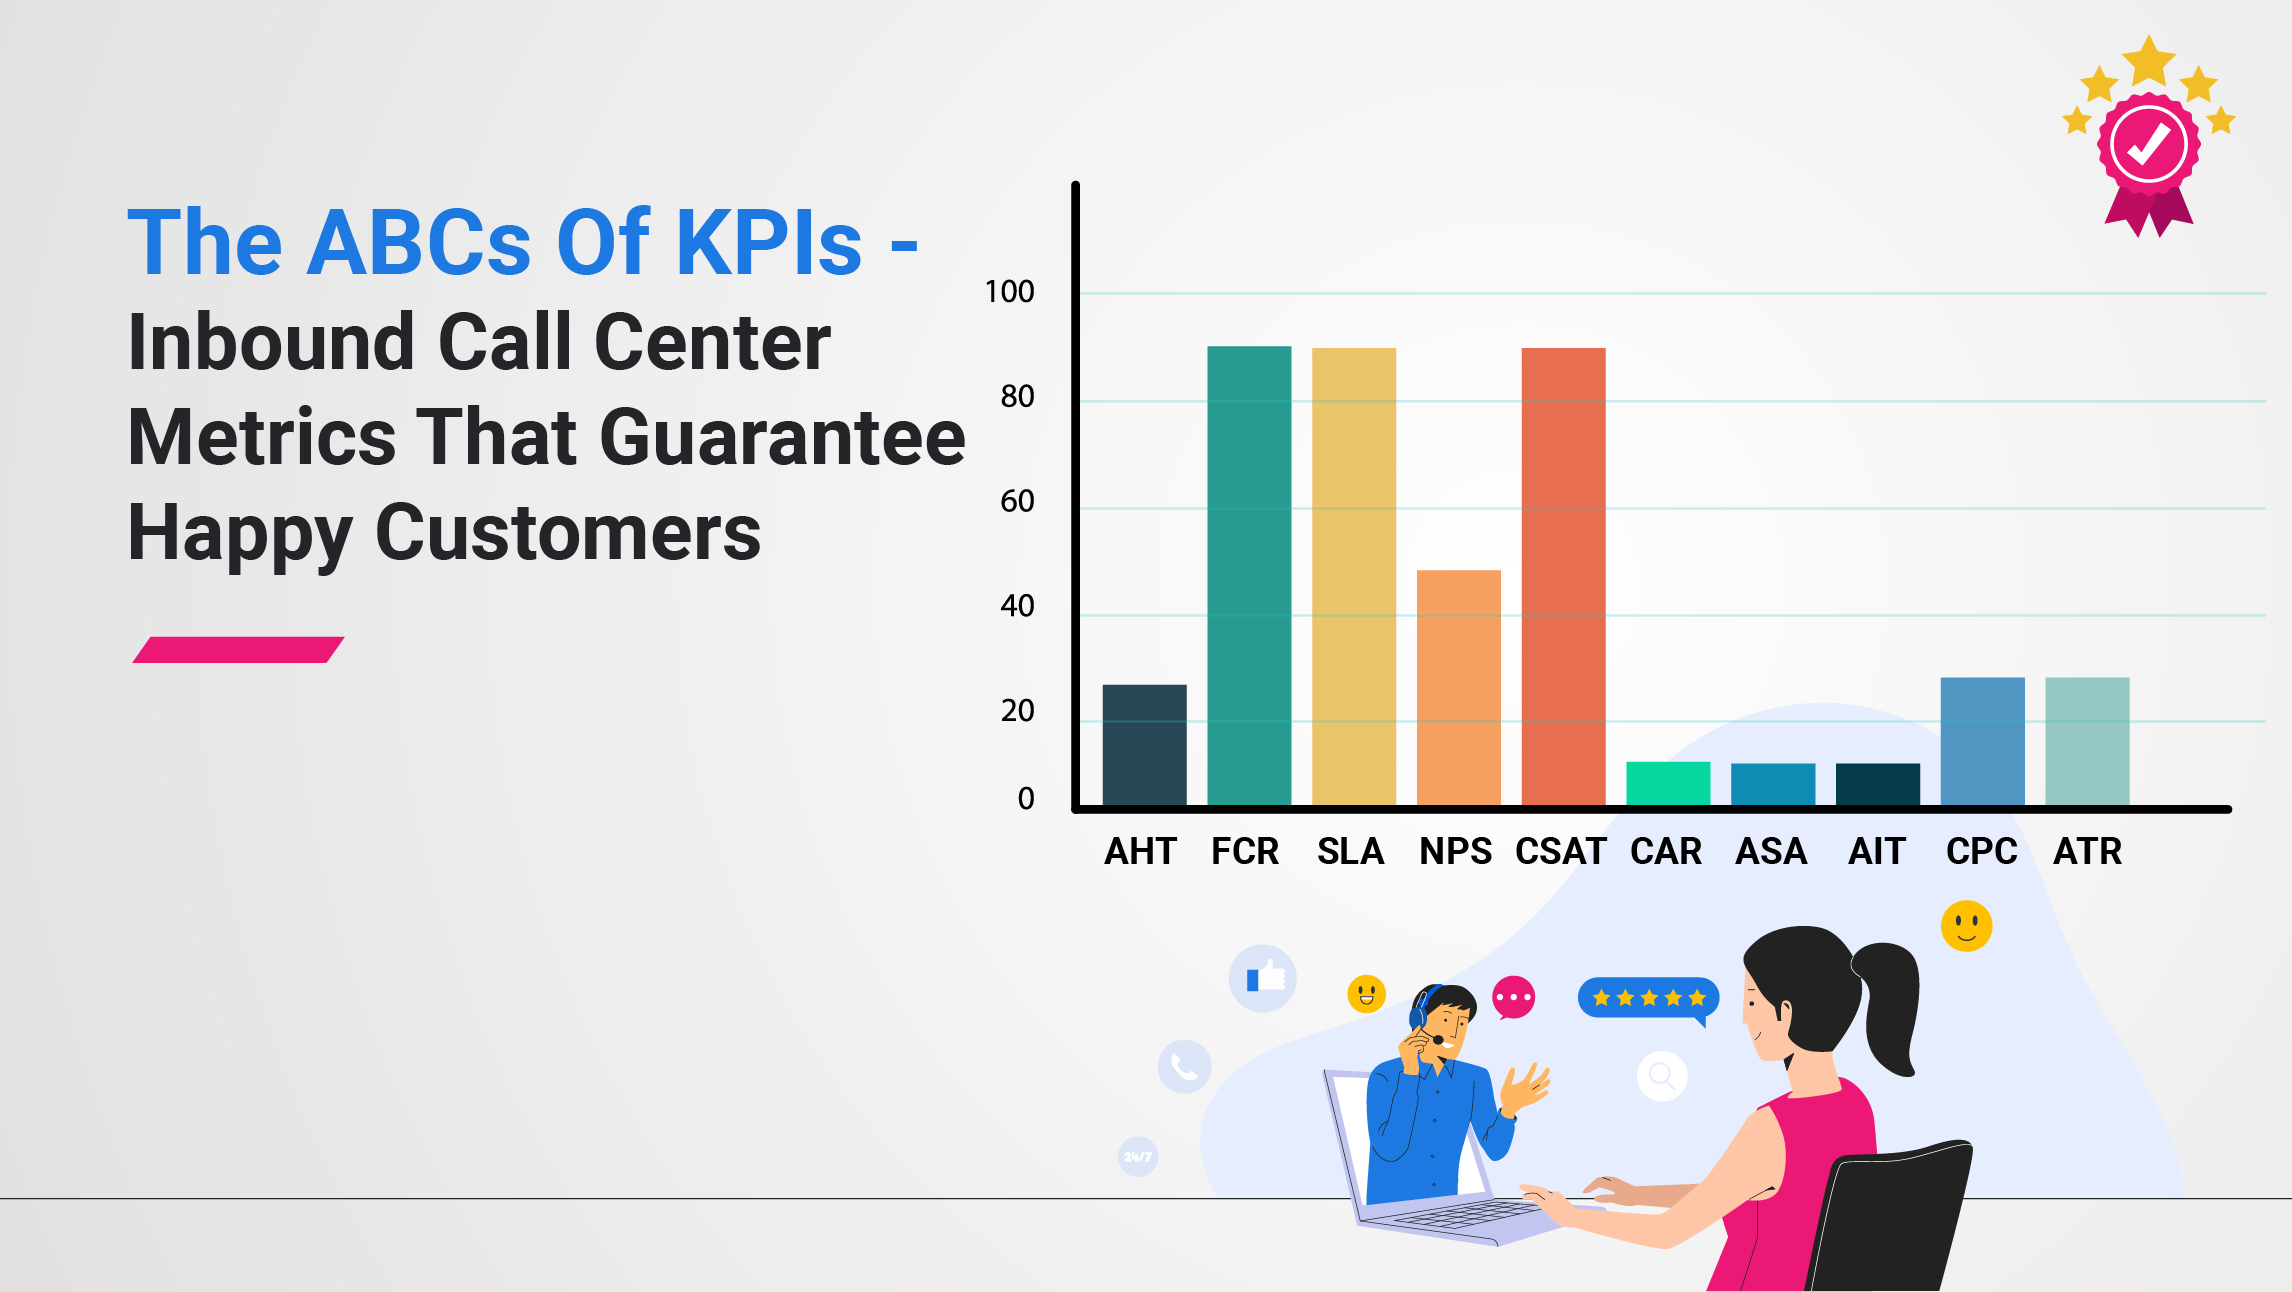
10 KPIs That Determine Professional Customer Care Excellence -
Here are the top 10 KPIs that every hiring company should closely monitor when assessing the performance of an inbound call center.
1. Average Handling Time (AHT):
Calculation: (Talk Time + Hold Time + Wrap-up Time) ÷ Total Number of Calls
AHT measures the average time a call center agent spends on a call, including talk time, hold time, and after-call work. AHT is always better when it is shorter; a necessity that often requires agents to strike the right chords between speed, accuracy and quality. Difficult as this may seem, it is achievable with perfect call routing, scripts and in-depth training.
2. First Call Resolution (FCR):
Calculation: Total Number of One-Touch Tickets ÷ Total Number of Resolved Tickets
FCR measures the percentage of tickets resolved during the first interaction, be it through calls, e-mails or live chats. Higher FCR indicates better customer satisfaction, reduced operational costs, and shorter handling times. Proficient 3P inbound helpdesks usually have high FCR and the mechanisms that can maintain this KPI through odd situations.
3. Service Level Agreements (SLA):
Calculation: Total Number of Calls Answered Within Set Time Limit ÷ Total Number of Offered Calls × 100
Service level indicates the percentage of calls / mails / chats answered within the time frame specified and agreed upon by the hiring companies and the professional customer care services. Adhering to SLAs is vital in ensuring prompt customer service and managing call center traffic effectively.
4. Net Promoter Score (NPS):
Calculation: Percentage of Promoters – Percentage of Detractors
A yardstick for customer loyalty, NPS delves into surveying, measuring and assessing the whys and wherefores of customer satisfaction. If you wish to know the likelihood of existing customers recommending your business to others; NPS is your solution. Often based on a single question, ‘Would you recommend our products / services to others;’ with a rating scale of 0 – 10, it is one of the best ways to determine if the call center should change, fix or maintain their strategies to boost customer retention and loyalty.
5. Customer Satisfaction (CSAT):
Calculation: (Total Number of Positive Responses ÷ Total Number of Collected Responses) × 100
CSAT measures customer satisfaction based on post-call surveys or feedback. A good Customer Satisfaction score ranges between 75% to 85%, which indicates that roughly, 3 out of 4 customers had a positive experience with the product / service / issue resolution. These indicators provide insights into the overall customer experience and help in evaluating service quality.
6. Call Abandonment Rate:
Calculation: (Number of calls Received – Number of Calls Handled) ÷ Number of Calls Received × 100
Did you know, as per market statistics, poor customer service can cost up to $75billion per year.
Call Abandonment rate refers to the percentage of callers that hang up before connecting with an agent. While there are many reasons why customers give up on a call before getting connected, high waiting time, response time and high overall effort to connect are pin-pointed as the primary triggers.
High call abandonment rates are indicative of customer dissatisfaction, which often leads to losing loyalty to competing businesses / brands. Call abandonment industry average currently stands at 12%. However, given the onslaught of e-commerce and the ever-rising number of customer queries and issues, abandonment rates within 20% may be considered an acceptable service level agreement. Quality contact center outsourcing companies often address call abandonments with prompt call return option which not only reduces wait time for customers but eases them of redressal anxieties as well.
7. Average Speed To Answer (ASA):
Calculation: Total Wait Time ÷ Total Number of Answered Calls
True effectiveness of professional inbound customer care solutions is reflective in their average speed to answer. The industry standard of ASA is around 28 seconds at the moment. However, any figure, plus/minus 5 seconds is an agreeable KPI. Low ASA clearly indicates that the chosen 3P contact center service providers are using right strategies like forecasting, issue resolution management, call routing etc. to maintain standards. Thus, they are not only increasing customer satisfaction score but, reducing costs significantly on your behalf, as well.
8. Agent Idle Time:
Calculation: Total Logged-in Tim – (Total Talk time + Hold time + Wrap up time)
Agent Idle Time refers to how often your agents are on ‘Not Ready’ mode. While there are no industry benchmarks with respect to the average idle time of agents, reliable contact centers are often seen maintain a 15% idle time vs 85% occupancy rate which ascertains very high efficiency and productivity making it an ideal growth set-up for hiring companies.
9. Cost Per Call (CPC):
Calculation: Total Cost of Calls ÷ Total Number of Calls
Cost cutting is one of the main reasons why call center outsourcing has become a necessity for businesses globally. Therefore, it only makes sense to evaluate cost per call as a KPI to determine cost-effectiveness of the 3P solutions for the latter, while aiding better resource allocation and management. Reliable contact centers are often seen implementing strategies like remote work models, utilization of cloud-based CRMs, blending apt automation technologies etc. to achieve minimized CPC for hiring companies.
10. Annual Agent Turnover Rate (ATR):
Calculation: Number of Agents Leaving ÷ Average Number of Agents
Agent turnover is a critical KPI to track because, it takes a lot of time and resources to onboard new agents and to align them with set task, which may take a toll on other essential metrics that can eventually compromise customer satisfaction. Although it may seem a little high, but 30% - 45% is considered an acceptable call center agent turnover rate. But anything exceeding 50% should be viewed seriously. Professional inbound customer care services employ a variety of agent retention strategies revolving around better compensations, relaxed work atmosphere, training, rewards etc. to boost motivation and create a harmonious work culture which goes a long way to serve the interests of hiring companies.
The Bottomline
These are only the top ten among a host of other KPIs that showcase the relevance of 3P Inbound Contact Center Outsourcing services for a hiring company. Monitoring these key performance indicators can literally measure the alignment of the service providers with your service expectations thereby assisting your business / company achieve target goals in terms of gaining and retaining customers, with ease.
Reference:
- https://www.convoso.com/blog/top-15-inbound-call-center-kpis/
- https://www.zendesk.com/in/blog/call-center-metrics-really-focus/
- https://www.leadsquared.com/learn/sales/call-center-kpis/
- https://surveysparrow.com/blog/customer-satisfaction-stats/#:~:text=81%25%20of%20customers%20are%20willing,1%25%20increase%20in%20cu
stomer%20satisfaction. - https://www.globenewswire.com/en/news-release/2023/05/03/2660579/0/en/Customer-Care-BPO-Market-Worth-34-57-Billion-Globally-by-2028-at-7-5-CAGR-The-Insight-Partners.html
- https://blog.hubspot.com/service/customer-satisfaction-score#:~:text=While%20CSAT%20scores%20vary%20by,a%20negative%20or%20neutral%20one.
- https://www.sisense.com/kpis/customer-service-kpis/average-speed-of-answer/